A Quick Walkthrough of Pillow's Sleep Analysis
Understanding your sleep patterns is key to improving sleep quality. Pillow provides a comprehensive sleep analysis to help you track and interpret essential sleep metrics. Here’s a quick guide to navigating the various sections of Pillow’s Sleep Analysis.

Sleep Stage Analysis
This section displays a detailed sleep stage diagram that illustrates your sleep progression through different stages:
- Deep Sleep
- REM Sleep
- Light Sleep
- Awake Time
You can tap and swipe on the diagram to view individual values at specific times during the sleep session, allowing for an in-depth look at your sleep patterns.
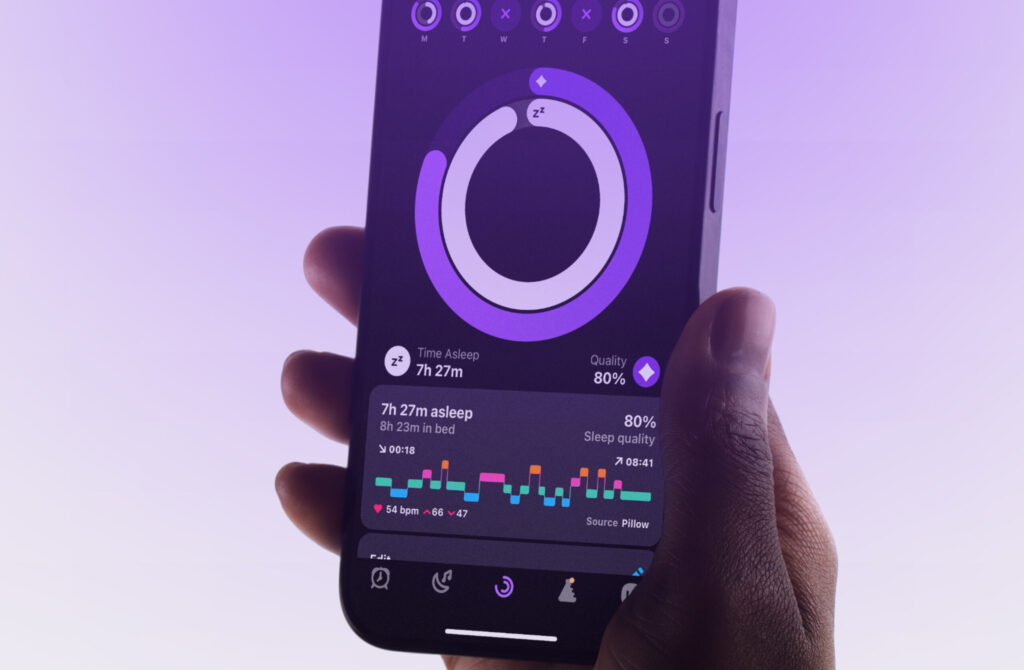
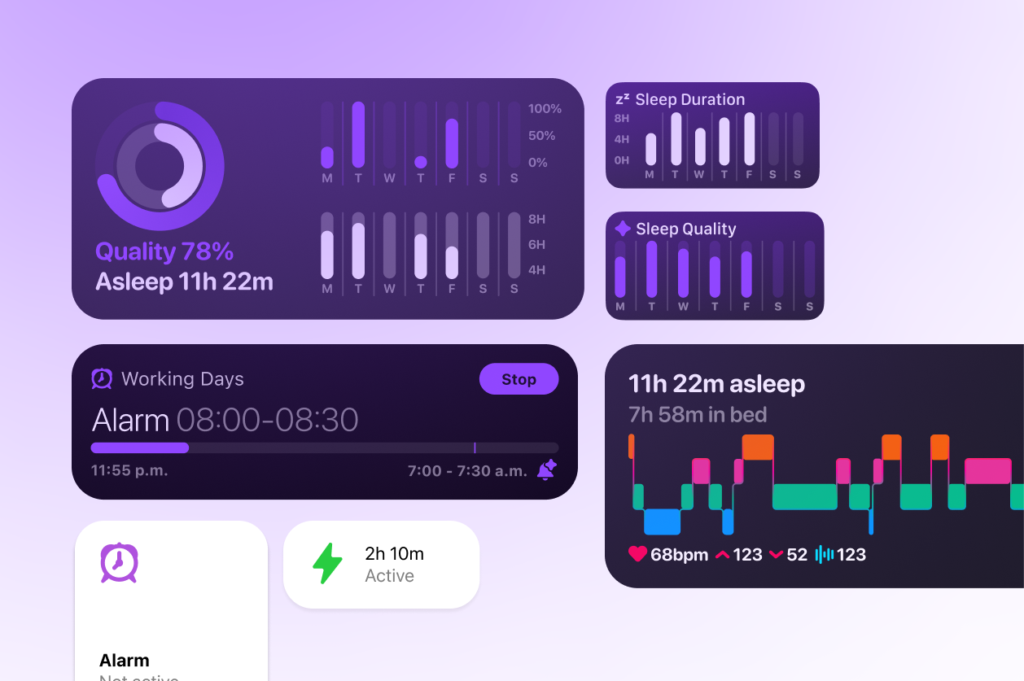
Sleep Score, Notes, and Mood
Directly beneath the sleep stage diagram, you can view your Sleep Score, which provides an overall assessment of sleep quality for that session. Additionally, you can log your wake-up mood and add personal sleep notes for better self-tracking.
Time Asleep, Time to Sleep, and Time in Bed
This section provides insights into:
- Total Time Asleep: Displays the amount of time spent asleep and the number of awakenings.
- Awakenings Analysis: Indicates whether the number of awakenings was within, above, or below expected levels.
- Sleep Duration: Shows whether your sleep duration was within the recommended range.
- Time to Sleep & Time in Bed: Offers insights into how long it took to fall asleep and the total duration spent in bed.
Sleep Stage Breakdown
- In this section, you can view a detailed breakdown of your sleep stages, including:
- The total duration spent in each stage.
- Percentage of time spent in each stage relative to your overall sleep session.
- Comparison to normal ranges, which is adapted based on your age for more accurate analysis.
Sleep Temperature
This section displays your average wrist temperature as measured by your Apple Watch. A chart shows the values of your sleep temperature over the past seven days to help you identify trends and patterns.
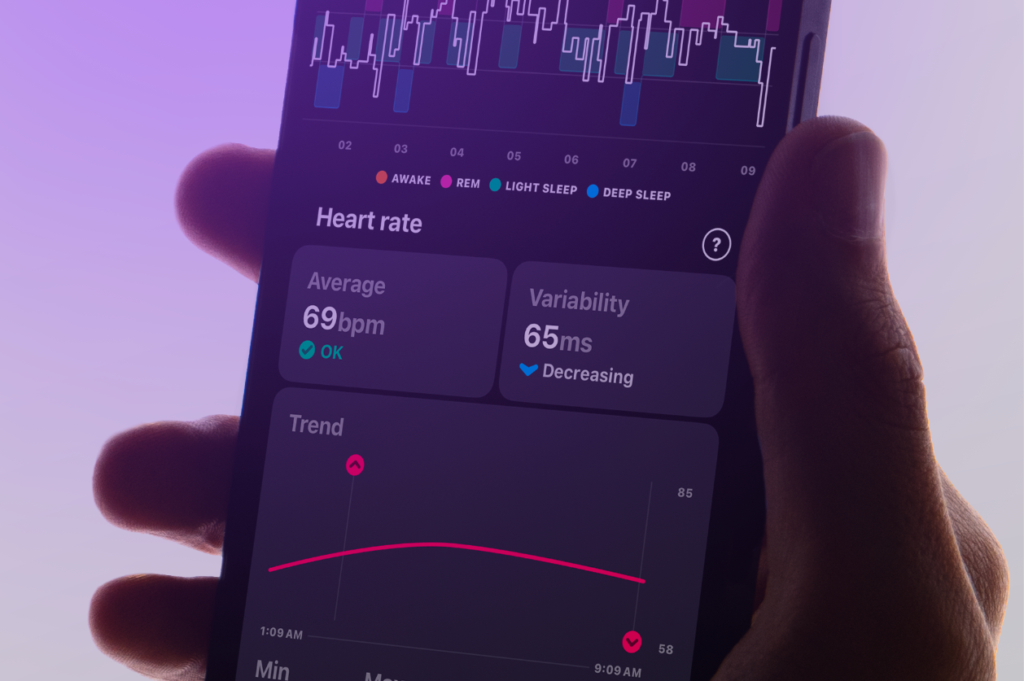
Heart Rate Analysis
Tapping on the Heart tab provides access to heart-related metrics:
- Heart Rate Diagram: Overlaid on the sleep stage graph to show how heart rate fluctuated in relation to sleep stages.
- Interactive Values: You can swipe your finger to view individual heart rate values at any point in the session.
- Average Heart Rate & Heart Rate Variability: Two essential metrics that indicate overall heart health and sleep recovery efficiency.
Heart Rate Trend
This section displays how your heart rate progressed throughout the night, highlighting:
- Optimal vs. irregular trends.
- Minimum and maximum heart rate values recorded during sleep.
Heart Rate Dip
A critical metric that indicates how much your heart rate dropped compared to your resting heart rate while awake. A healthy dip is typically associated with good recovery and restorative sleep.
Average Heart Rate per Sleep Stage
This section provides a breakdown of your average heart rate during each sleep stage, helping to identify any significant fluctuations that may affect sleep quality.
Blood Oxygen Levels
This section includes a chart of your blood oxygen levels throughout the sleep session, displaying:
- Average, minimum, and maximum values.
- Indicators showing whether these values fall within the normal/expected range.
Respiratory Rate
- Directly under Blood Oxygen Levels, this section presents:
- A chart displaying your respiratory rate during sleep.
- Average, minimum, and maximum values.
- Indicators showing whether these values are within a healthy range.
For each metric above, you can tap the question mark icon in the top-right corner of the section for more details and explanations.
Environmental Audio Levels
Switching to the Audio tab displays a chart that measures environmental noise throughout the night, as detected by your Apple Watch sensors. Values are shown in decibels (dB), with:
- Average, minimum, and maximum noise levels.
- Indicators to determine if the noise was within a comfortable range for sleep.
Audio Recordings
- This section contains all audio recordings captured by Pillow. These recordings require either an iPhone or iPad. Features include:
- Machine Learning Categorization: Pillow automatically categorizes recordings (e.g., snoring, talking, background noise).
- Playback, Export, Delete, and Re-Categorization Options.
- Customizable Sleep Sound Detection: Disable certain sound categories as needed.
With this structured walkthrough, you’ll be able to navigate Pillow’s Sleep Analysis efficiently and make the most of your sleep tracking experience!
Learn more
Download Pillow

Get help
Press & News
Legal
Connect
X (Twitter)
Affiliates & Partnerships
Company
Copyright © Neybox Digital Ltd.